CALMIT Drought Research Projects

CALMIT Drought Research Projects

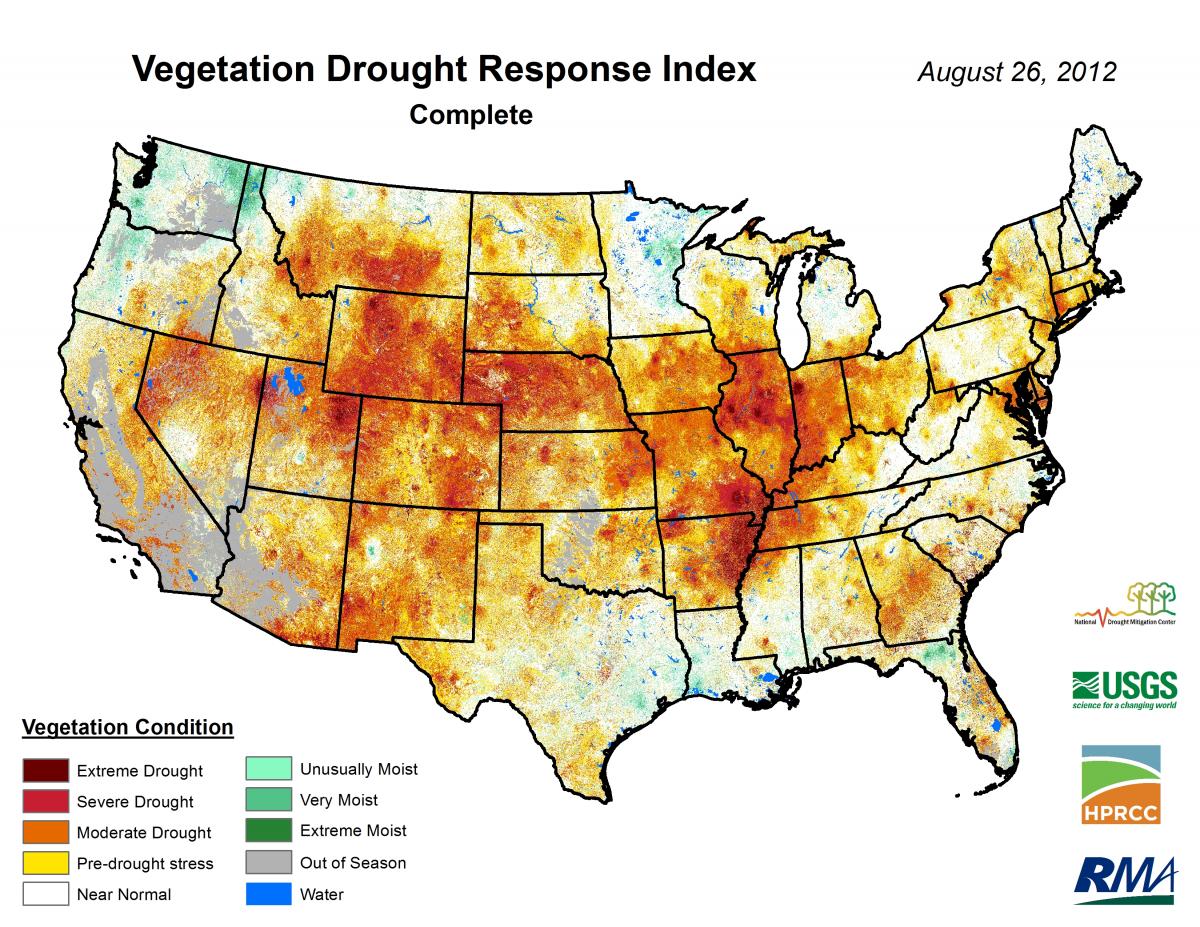
VegDRI: Vegetation Drought Response Index

1-km VegDRI map showing the severe to extreme drought conditions that persisted across most of the central U.S. during the summer of 2012.
Image: 1-km VegDRI map showing the severe to extreme drought conditions that persisted across most of the central U.S. during the summer of 2012.

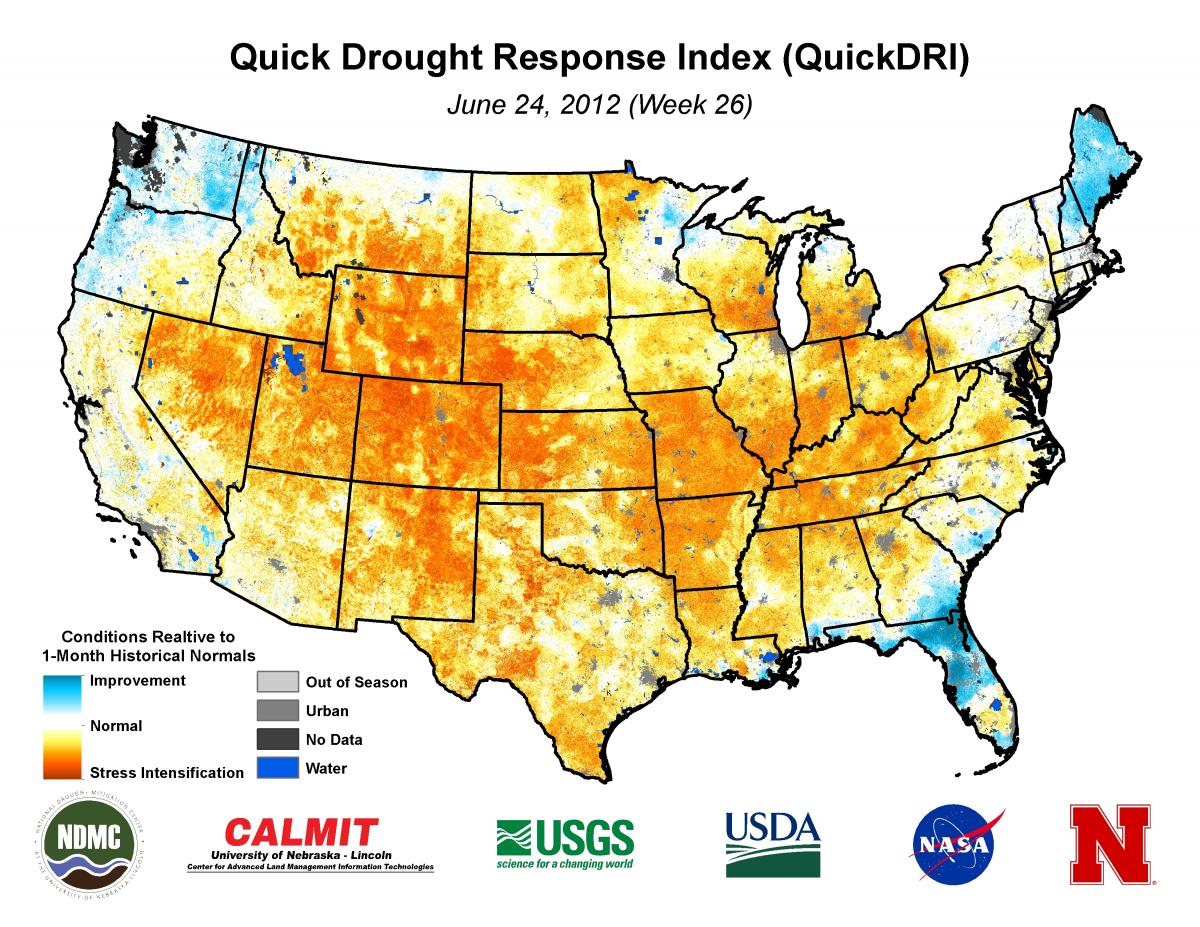
QuickDRI: Quick Drought Response Index

1-km QuickDRI map showing the intense short-term drought conditions across much of the United States as the severe to extreme 2012 drought event emerged.
Image: 1-km QuickDRI map showing intense short-term drought conditions across much of the United States as the severe 2012 drought event emerged.

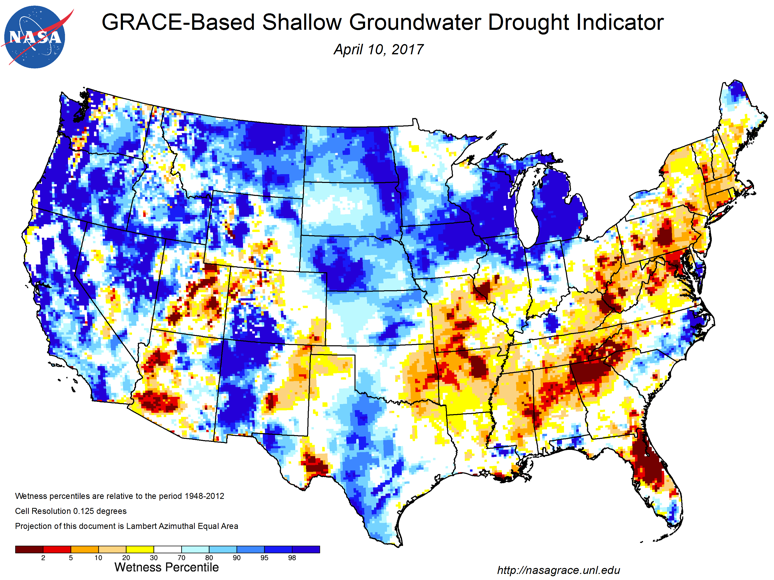
GRACE: Terrestrial Water

GRACE shallow groundwater, indicators depicting drought conditions in parts of the southeastern U.S. in April 2017.
Image: GRACE shallow groundwater indicators depicting drought conditions in parts of the southeastern U.S. in April 2017.

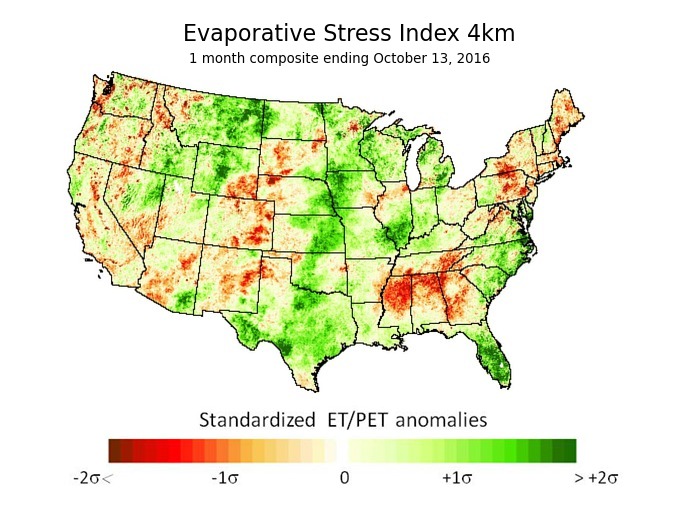
ESI: Evaporative Stress Index

Evaporative Stress Index (ESI)
Image: ESI map with a 4-km resolution for the continental U.S. for October 13, 2016.

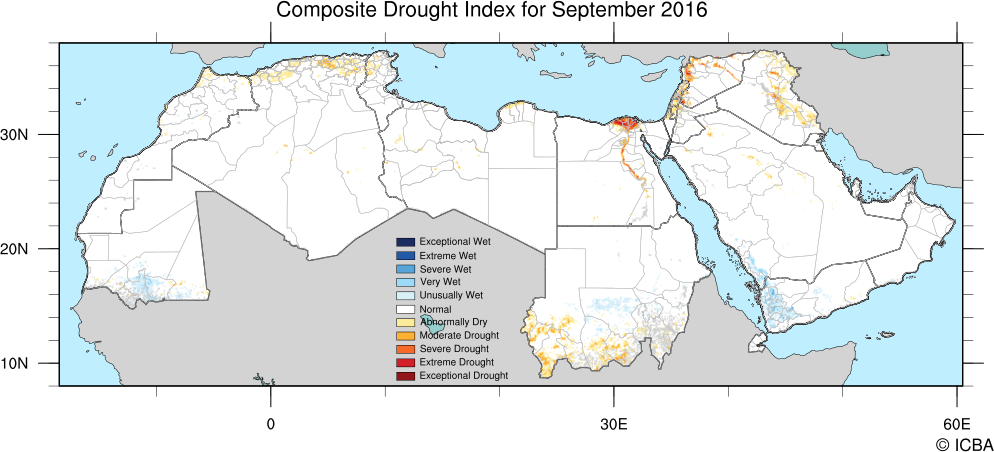
MENA CDI: Composite Drought Index (CDI) for the Middle East and North Africa (MENA) Region

Image: MENA CDI map for September 2016

CALMIT logo banner