Research questions:
The land surface, including vegetation, soils and water bodies, are affected by climate, and also affect climate through feedback processes. For example, plants absorb carbon dioxide through photosynthesis, and release water vapor through evapotranspiration, and influence air temperature through their changing reflectivity (albedo). These processes change with current weather and prevailing climate, and also further influence the atmosphere and climate.
Land surface phenology describes the seasonal growth cycle of vegetation and represents an important part of climate-land surface interactions.
How do we track phenological cycles and variations in these cycles?
CALMIT researchers use remotely sensed data ranging from satellite imagery to close-range spectral observations to characterize vegetation phenology and investigate the relationship between land surface phenology patterns and climate and hydrology.
What can we learn by tracking vegetation phenology?
Year-to- year variations in the timing of specific phenological events (e.g., green onset) can influence biogeochemical cycles and serve as indicators of inter-annual climate variability and longer-term trends, land use/land cover change, environmental stress, land degradation and changes in plant species compositions across the landscape.
Estimation of Crop Growth Stage
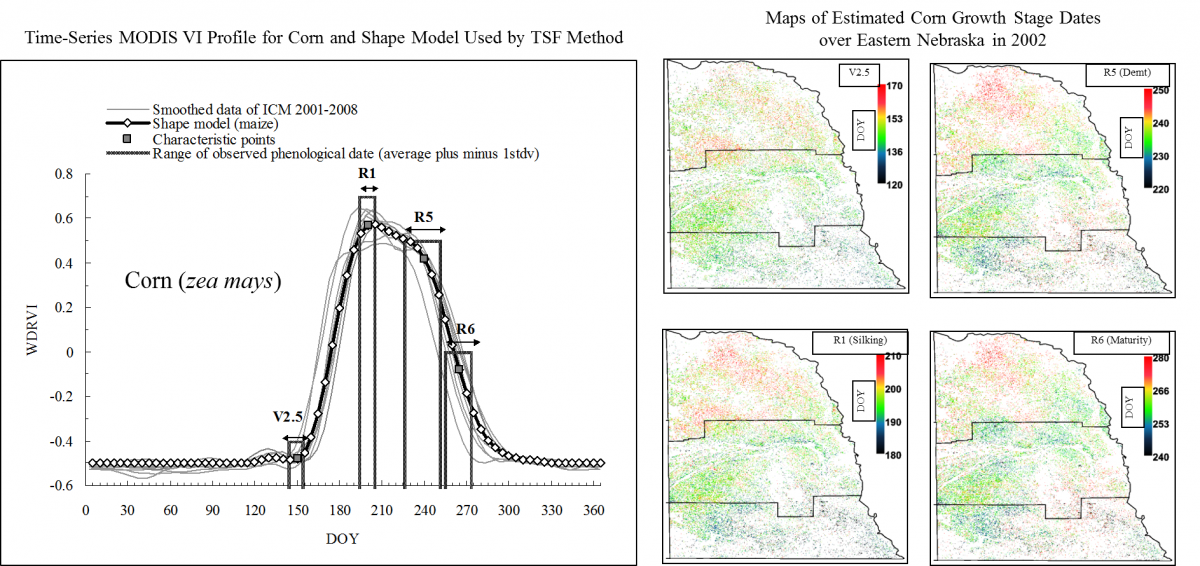
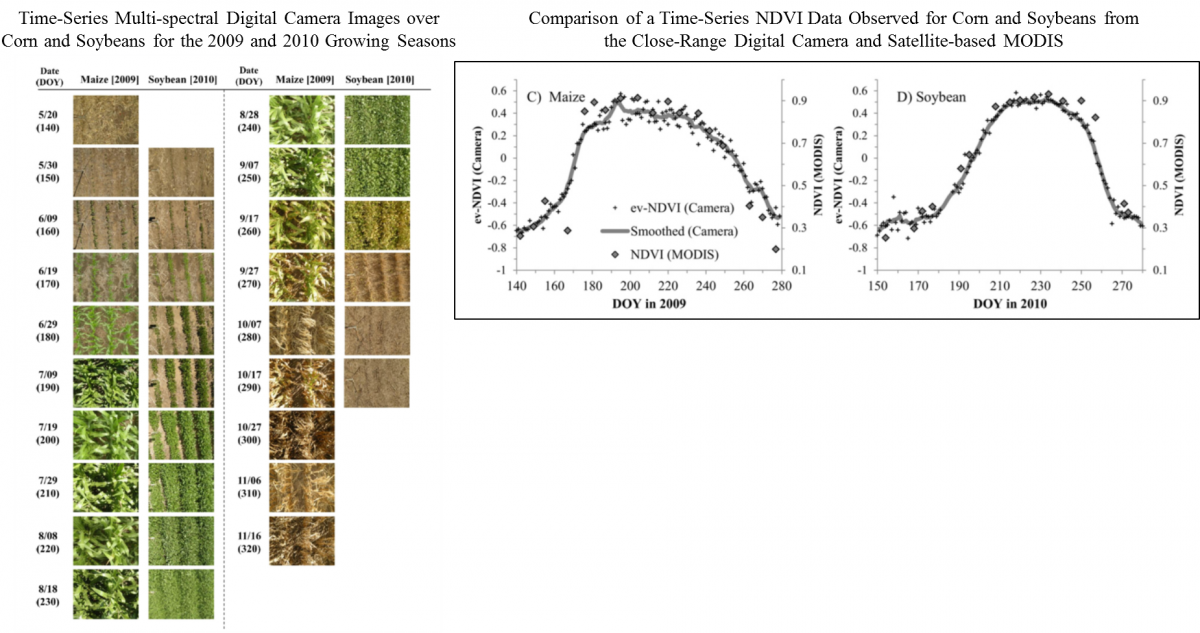
Research involved the development of a crop phenology detection method called the Two-Step Filtering (TSF) to estimate and map critical agronomic growth stages of corn (e.g., silking) and soybeans (e.g., flowering) from time-series MODIS 250-meter vegetation index data. Recent work has focused on modifying the original TSF method develop by Sakamoto et al. (2010) to include a satellite-based land surface temperature component that reflects climatic-related factors such as air temperature and photoperiod, which influence crop phenology. The use of commercial digital camera systems to estimate and monitor canopy-level phenology of crops at close range has also been investigated through the work of Sakamoto et al. (2012).
Center Faculty: Wardlow
Collaborators:
1. Corn growth stages

2. Comparison of close-range digital images to MODIS green chlorophyll index

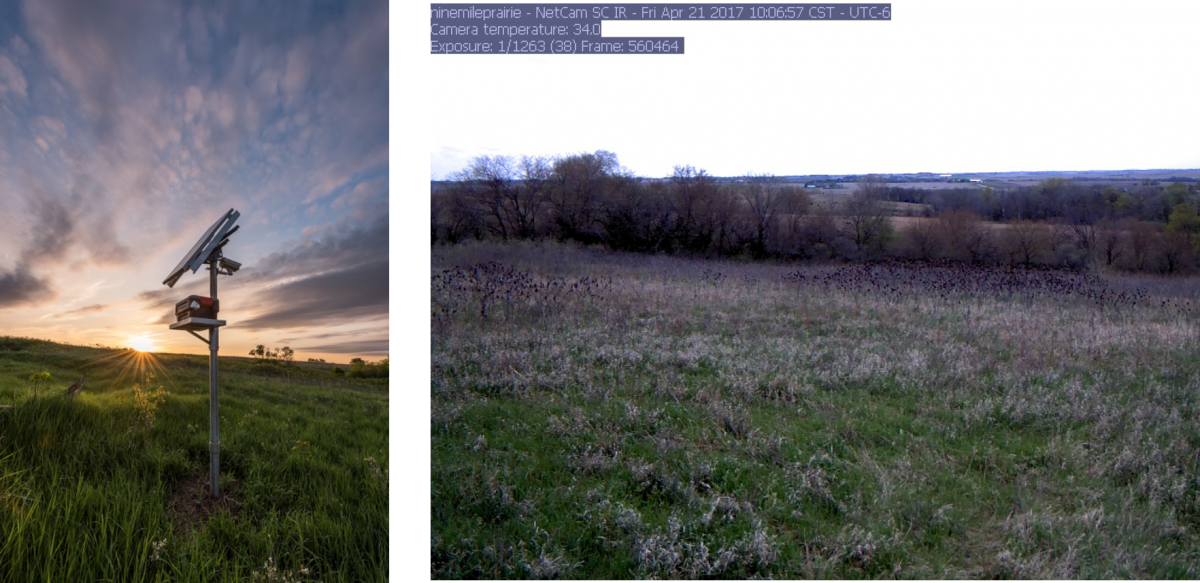
CALMIT PhenoCam at Nine-Mile Prairie
Collaborative project with the North Central Climate Science Center and the AmericaView program to develop a network of phenocams across the north central U.S. to collect a temporally-dense series of digital images to document ground-based phenology. CALMIT maintains a phenocam (live phenocam image feed at http://166.248.104.41/) at the University of Nebraska’s Nine Mile Prairie (https://grassland.unl.edu/nine-mile-prairie) collecting multispectral image data. Research is focusing on the analysis of the phenocam imagery for vegetation species classification and investigating inter-annual phenological variations of the prairie landscape.
Read More PhenoCam Network Latest Image
Center Faculty: Wardlow
Collaborators:

Footer
