CALMIT Research

Research Areas

Drought

Image: 1-km VegDRI map showing the severe to extreme drought conditions that persisted across most of the central U.S. during the summer of 2012.

Read More

Vegetation Drought Response Index map shows U.S. vegetation conditions on August 26, 2012. Legend marks extreme-to-moderate drought in reds and orange, pre-drought stress in yellow, near-normal conditions in gray, and moist conditions in green and blue, with widespread drought across Great Plains, Midwest, and Southwest.

Climate/land surface interactions

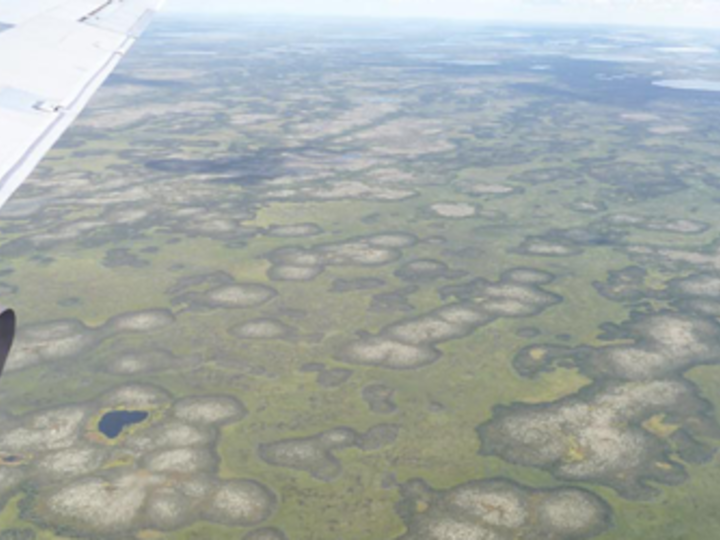
Image: Arctic baydjarakhs (high-centered polygons). Vegetation albedo forms these landscape features, though their future is uncertain in a changing climate.
Read More

Aerial photograph shows airplane wing above a broad green landscape dotted with irregular wetlands and small dark lakes. View highlights varied terrain patterns, including pale marshy patches, winding water channels, and distant flat plains.

Vegetation status and productivity

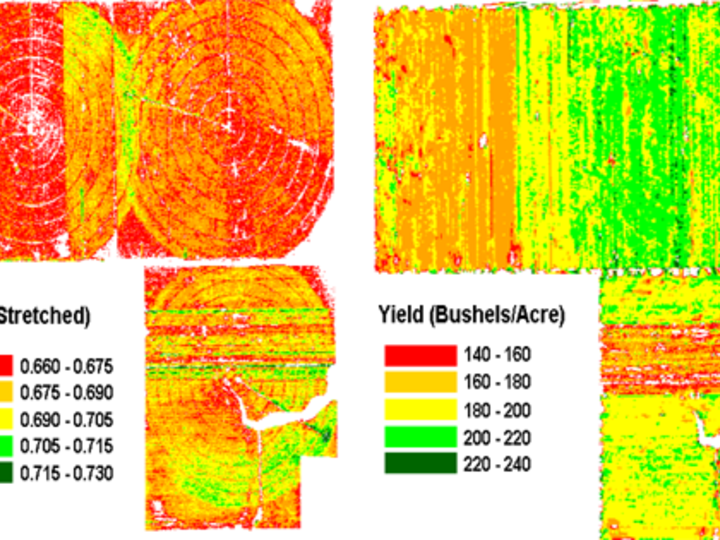
Image: Vegetation index, yield maps of Nebraska cornfields. (Crop Yield Monitoring project)
Read More

Agricultural field-variability maps compare a stretched measurement ranging from 0.660–0.730 with yield, labeled “Yield (Bushels/Acre).” Red-to-dark-green legends show lower-to-higher values, with yield classes spanning 140–160 through 220–240 bushels per acre and irregular field zones revealing spatial variation.

Ecosystem health/biodiversity

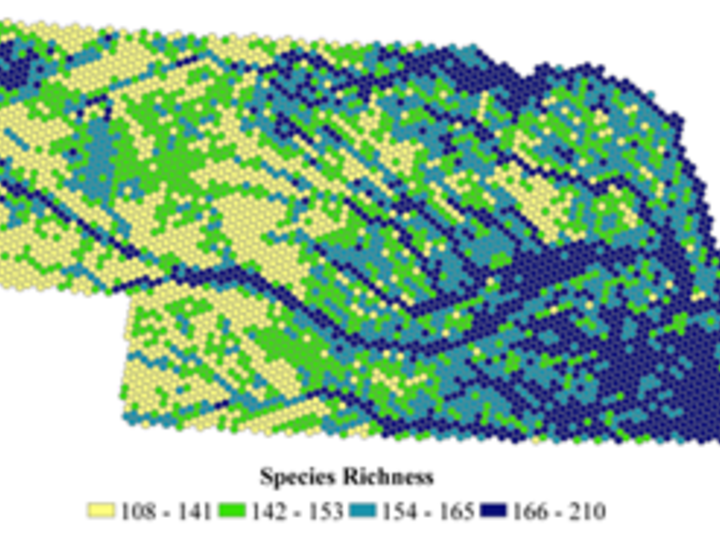
Image: Total species richness distribution by quartile (modeling hexagon). (Nebraska GAP project)
Read More

Pixelated species-richness map displays spatial variation across Nebraska. Color legend shows yellow-green values 108–141, bright green 142–153, teal 154–165, and dark blue 166–210, with highest richness concentrated across lower-right and central areas.

Hydrology, drought, soil moisture

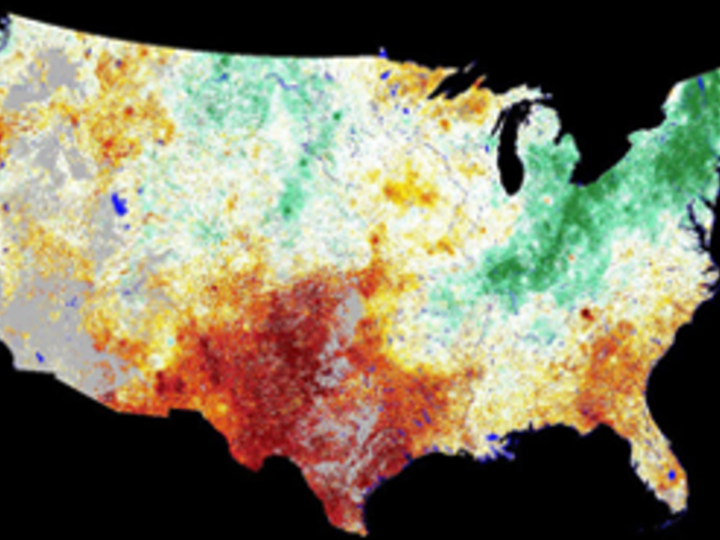
Image: Vegetation Drought Response Index (VegDRI) for the first week of October in 2011. (VegDRI project)
Read More

False-color thematic map of contiguous United States visualizes geographic variation in an environmental measurement. Red and orange dominate central and southern regions, green concentrates across northern and northeastern states, pale yellow and white cover much of West, with black surrounding background.

Land use/land cover

Image: 2005 Land use patterns from Landsat 5 images and Nebraska Natural Resource Districts data.

Read More
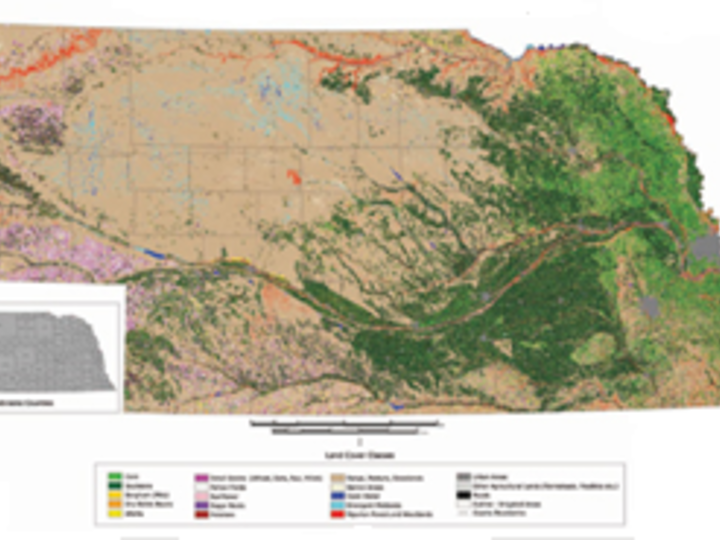
Color-coded thematic map depicts regional land-cover or ecological classes, with tan arid terrain, dark-green forested areas, purple and pink zones, and red or blue linear features. Bottom legend lists mapped classes alongside a small grayscale inset and scale bar, supporting geographic interpretation and comparison.

Facilities and tools used to answer research questions include:

  • Hyperspectral, multispectral, and optical remote sensing
  • Satellite image data (Landsat, SPOT, AVHRR, MODIS, IKONOS, SeaWIFS, etc.)
  • Flux data
  • Geographical information systems (GIS)
  • Spatial modeling

Find out more about CALMIT research facilities, platforms, and labs here.

Research questions contribute to the body of knowledge regarding:

  • Satellite data validation
  • Efficacy of precision agriculture methods
  • Renewable resources management
  • Environmental hazard assessment
  • Estimation of biophysical parameters of vegetation (e.g., leaf area index, production, fractional cover)

CALMIT Logo