Quantifying how our world changes
Remote sensing helps us to quantify land use/land cover change and to track changes in vegetation cover, productivity, and health for large regions over time.
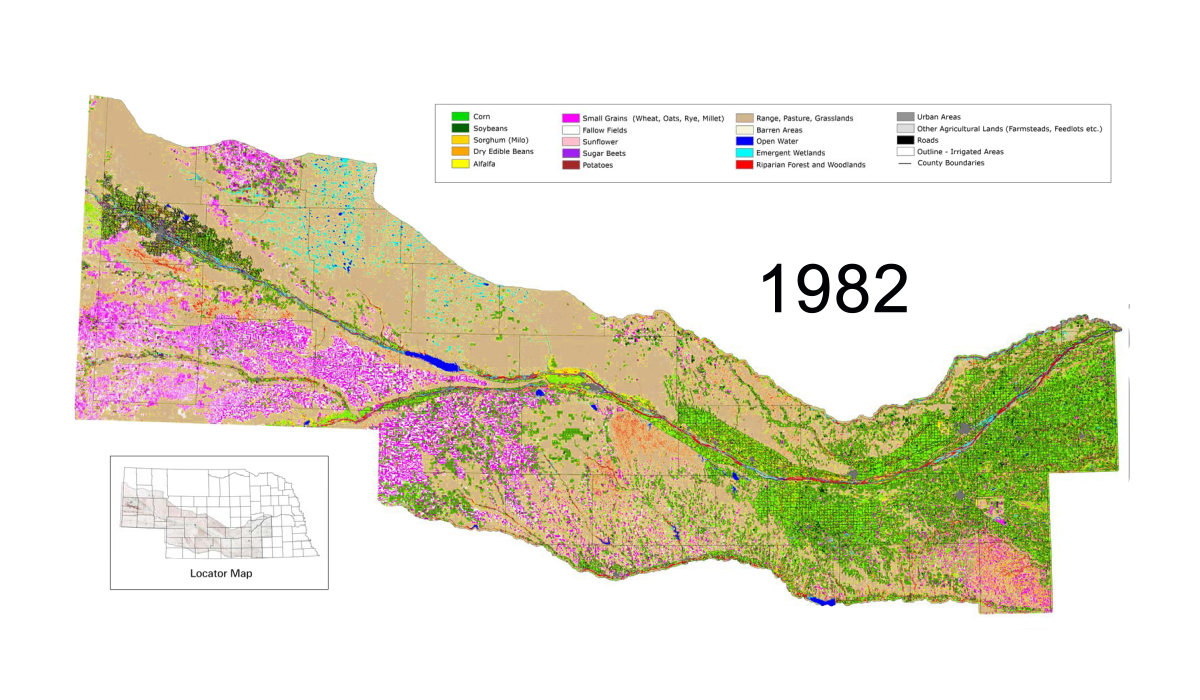
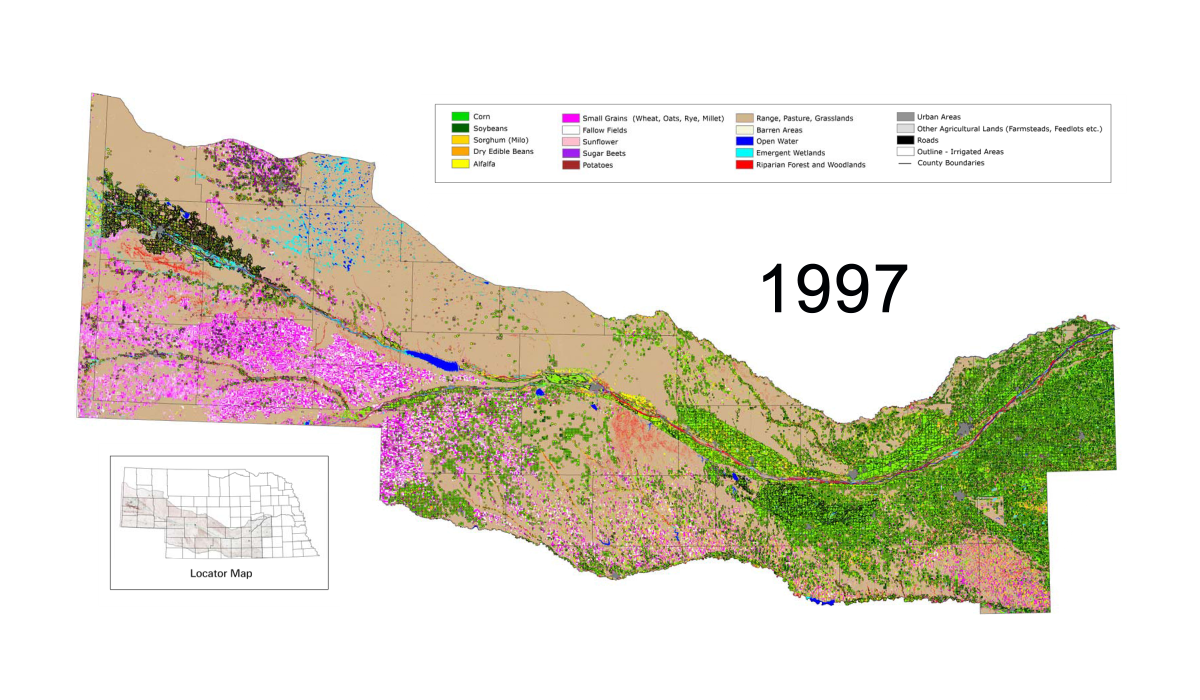
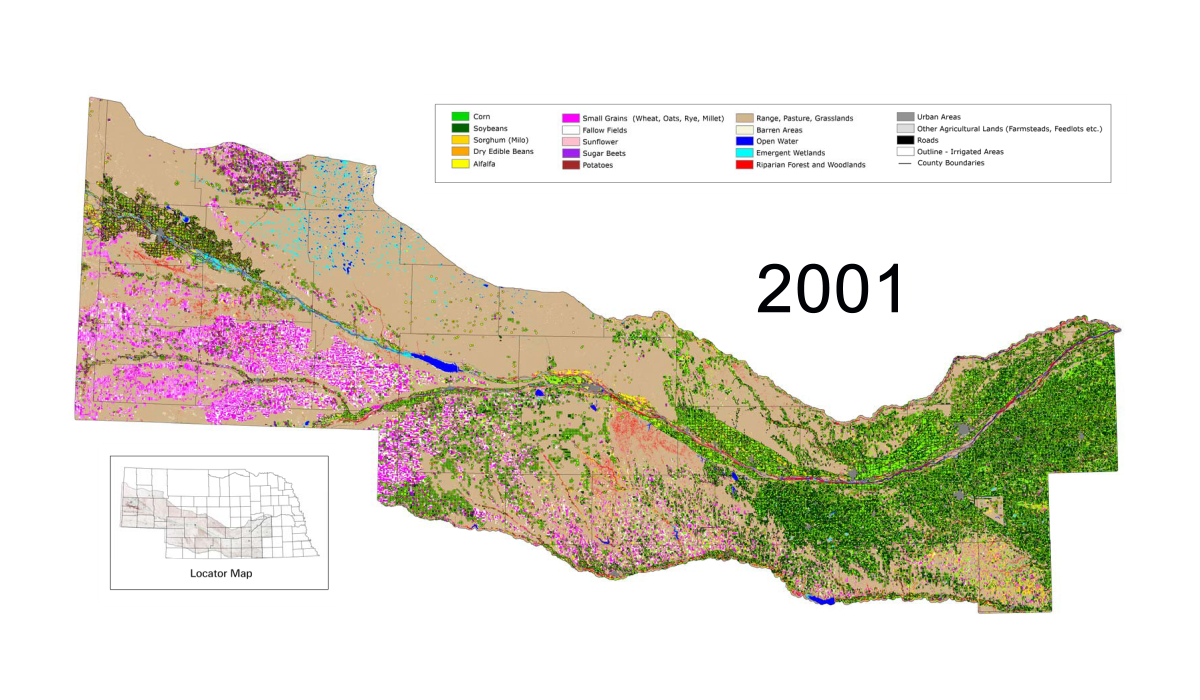
The images below are an example of how remote sensing helps us identify these changes. The images show changes in agricultural usage along the Nebraska portion of the Platte River Basin.
Click on the tabs/years (1982, 1997, 2001, 2005) above the image to see how Nebraska's crops and pastureland has changed in three decades. Maps were prepared as a part of the CALMIT COHYST project.
Land use/land cover change can also be used to describe other important landscape-level changes such as habitat quality, vegetation fragmentation, biodiversity, and much more.
Land cover maps
1982
1997
2001
2005
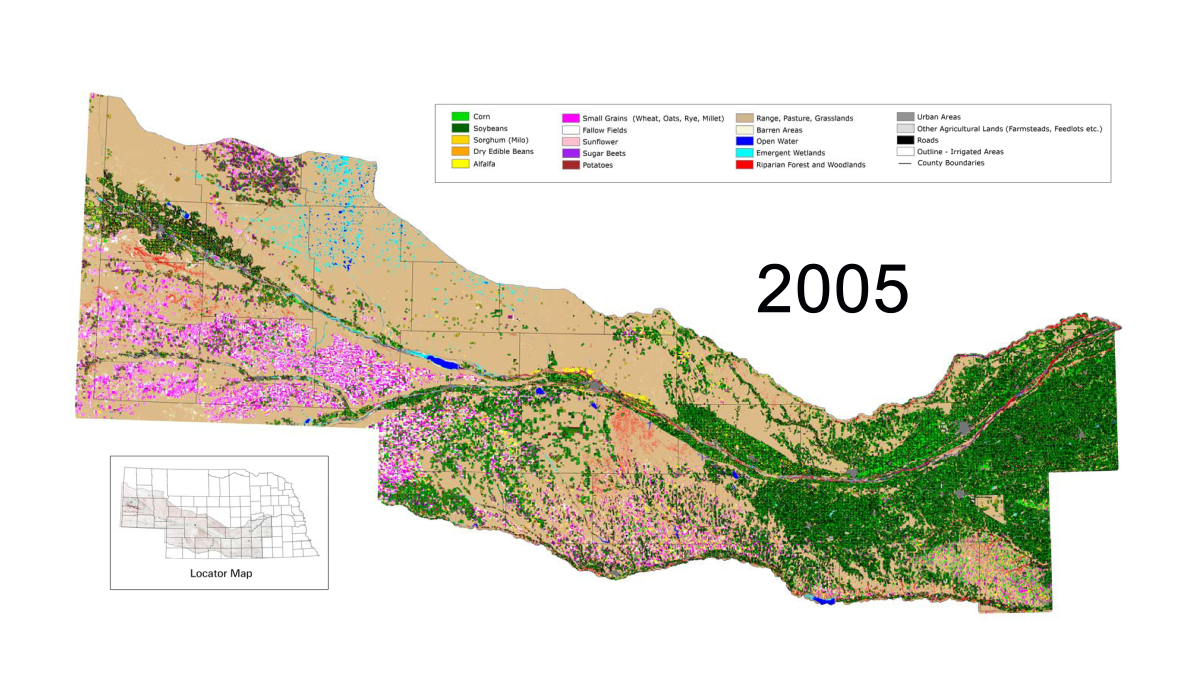
What do the maps tell us?
Soybeans became a more dominant crop throughout Nebraska, primarily displacing corn; cultivation of small grains declined, particularly in the southwestern portion of the study area, giving way to rangeland; open water areas, diminished in 2005 when compared to other years.
Download full-sized COHYST maps from the CALMIT COHYST project webpage.
Publication